
My house now runs a homebrew energy monitor: a Raspberry Pi reads the electricity meter + solar inverter, and an iOS app I built with Claude shows live power, solar, battery — and exactly how much money the sun saved me today.
How it works 🧵⚡☀️


Wiza Jalakasi
@wizaj
The plumbing:
• Energy meter (Modbus TCP) → whole-house grid power, per phase
• Deye hybrid inverter → PV, battery, load (read locally via its WiFi logger, no vendor cloud)
• Pi 5 runs a small FastAPI service polling both
• TimescaleDB for history, REST + SSE for live data
• Energy meter (Modbus TCP) → whole-house grid power, per phase
• Deye hybrid inverter → PV, battery, load (read locally via its WiFi logger, no vendor cloud)
• Pi 5 runs a small FastAPI service polling both
• TimescaleDB for history, REST + SSE for live data
12:34 PM UTC · Aug 19, 2026 · 1.7K Views
20164

Wiza Jalakasi
@wizaj
The app is pure SwiftUI, zero third-party deps. Live screens ride Server-Sent Events — instant first frame, ~1s updates while open. Close the app and the backend slows its polling to spare the hardware. Charts are Swift Charts over server-aggregated hourly/daily buckets.
12:34 PM UTC · Aug 19, 2026 · 1.6K Views
10152

Wiza Jalakasi
@wizaj
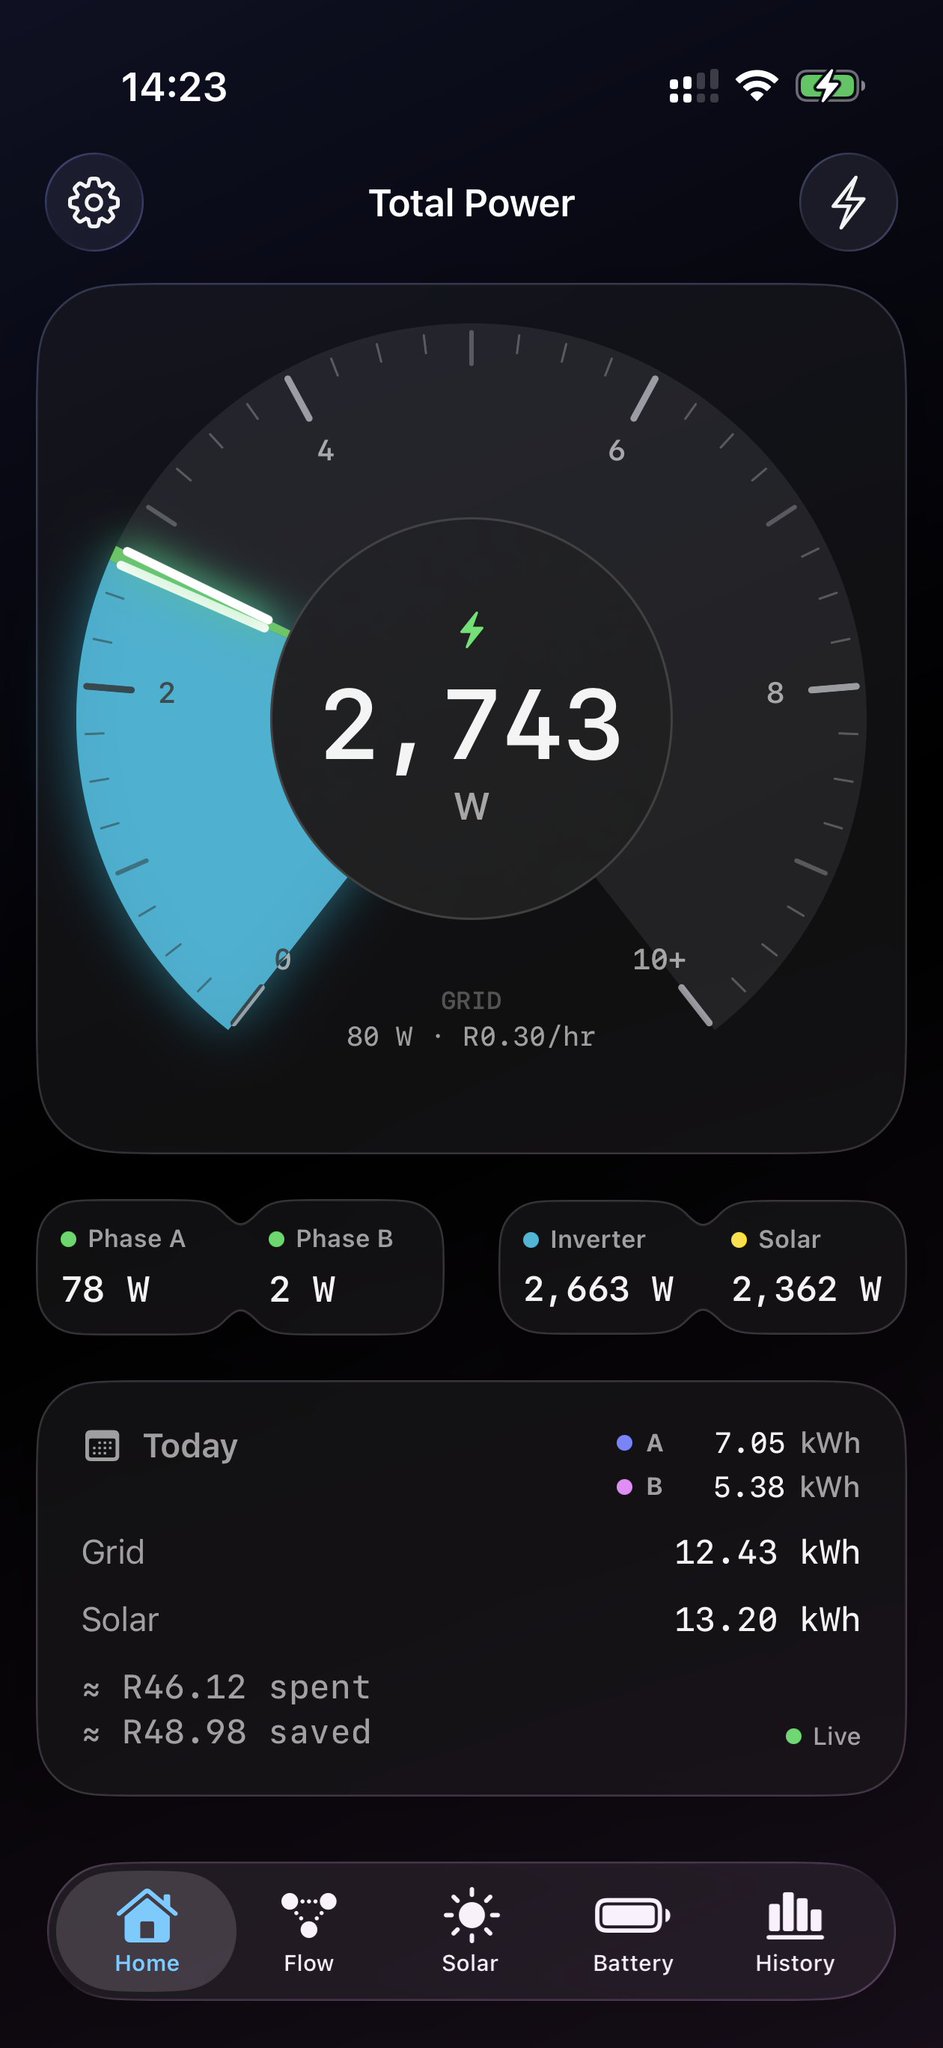
Favourite detail: the hybrid gauge. One dial, two segments stacked from the same zero — teal is inverter output (solar+battery), green→red is grid draw on a severity gradient. The boundary needle IS the inverter reading; the leading edge is total home load. 5 design iterations.
12:34 PM UTC · Aug 19, 2026 · 1.4K Views
10100

Wiza Jalakasi
@wizaj
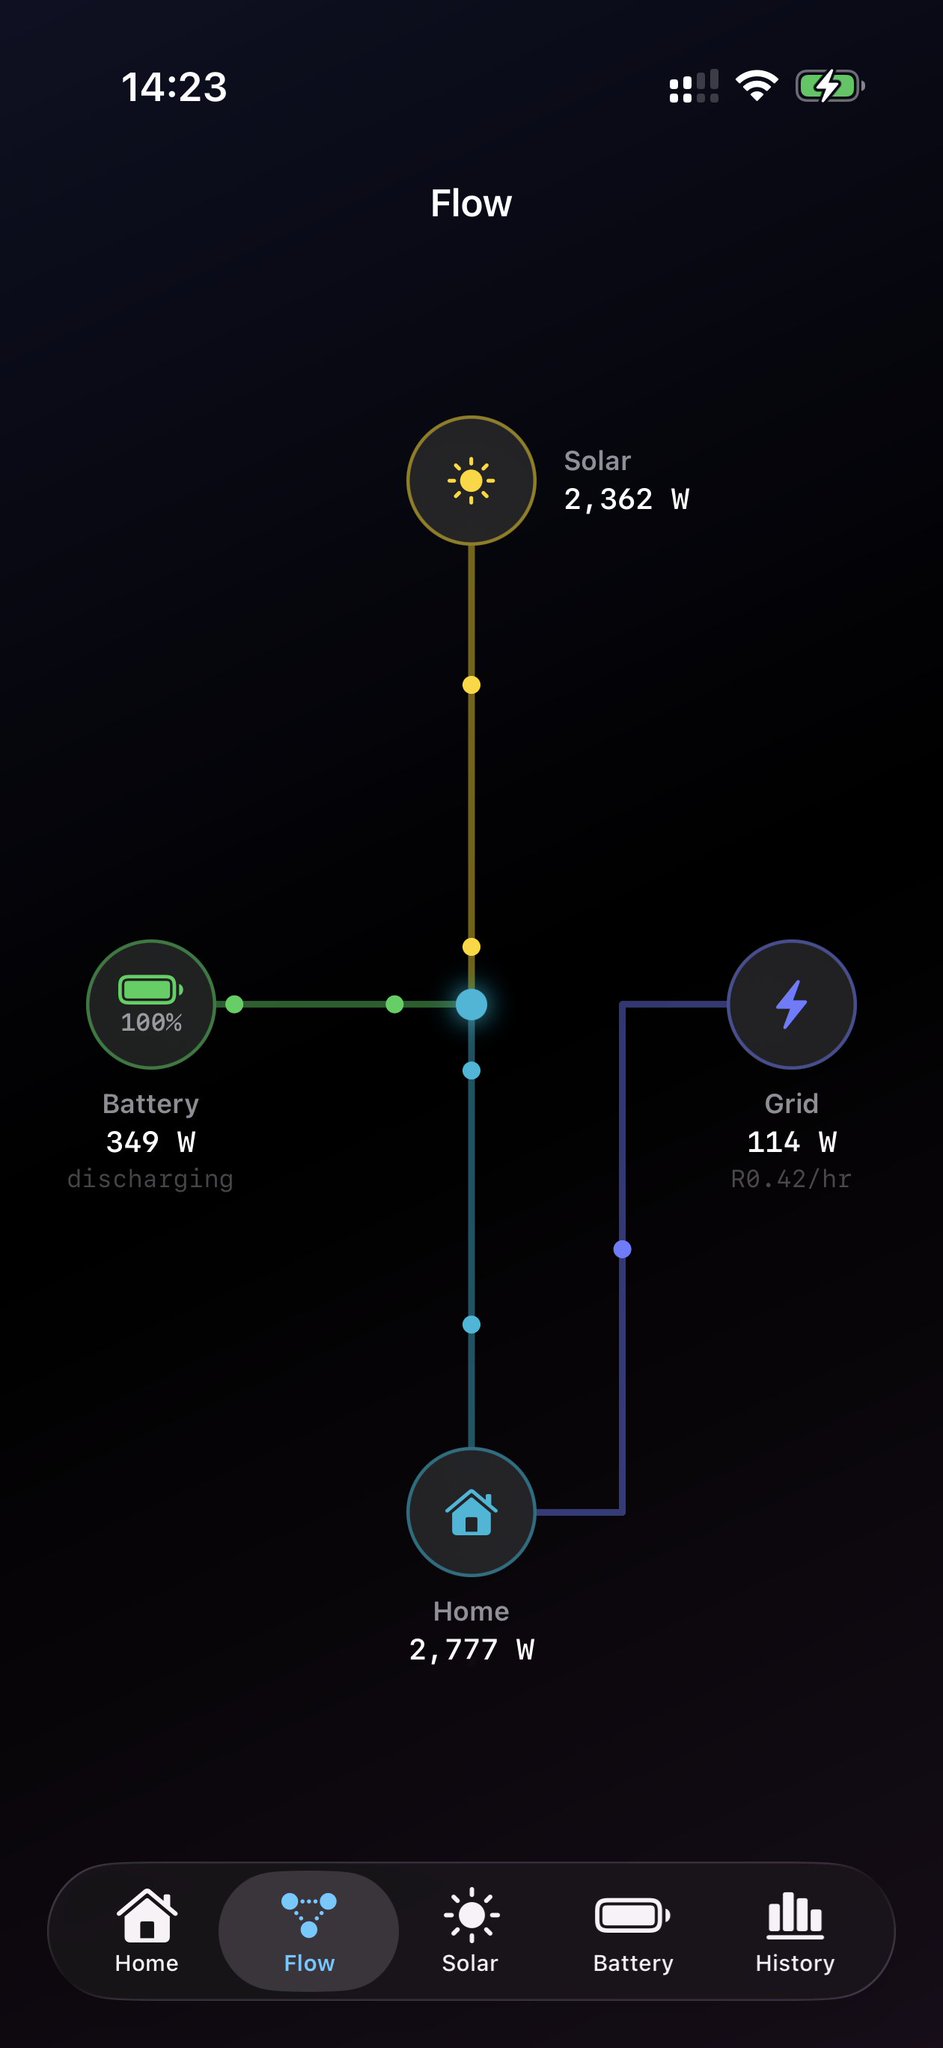
There's a live energy-flow view: solar feeds the inverter junction, the battery charges or discharges through it, the grid comes in on its own line. Animated dots travel along whichever edges are actually carrying power right now.
12:34 PM UTC · Aug 19, 2026 · 1.2K Views
1080

Wiza Jalakasi
@wizaj
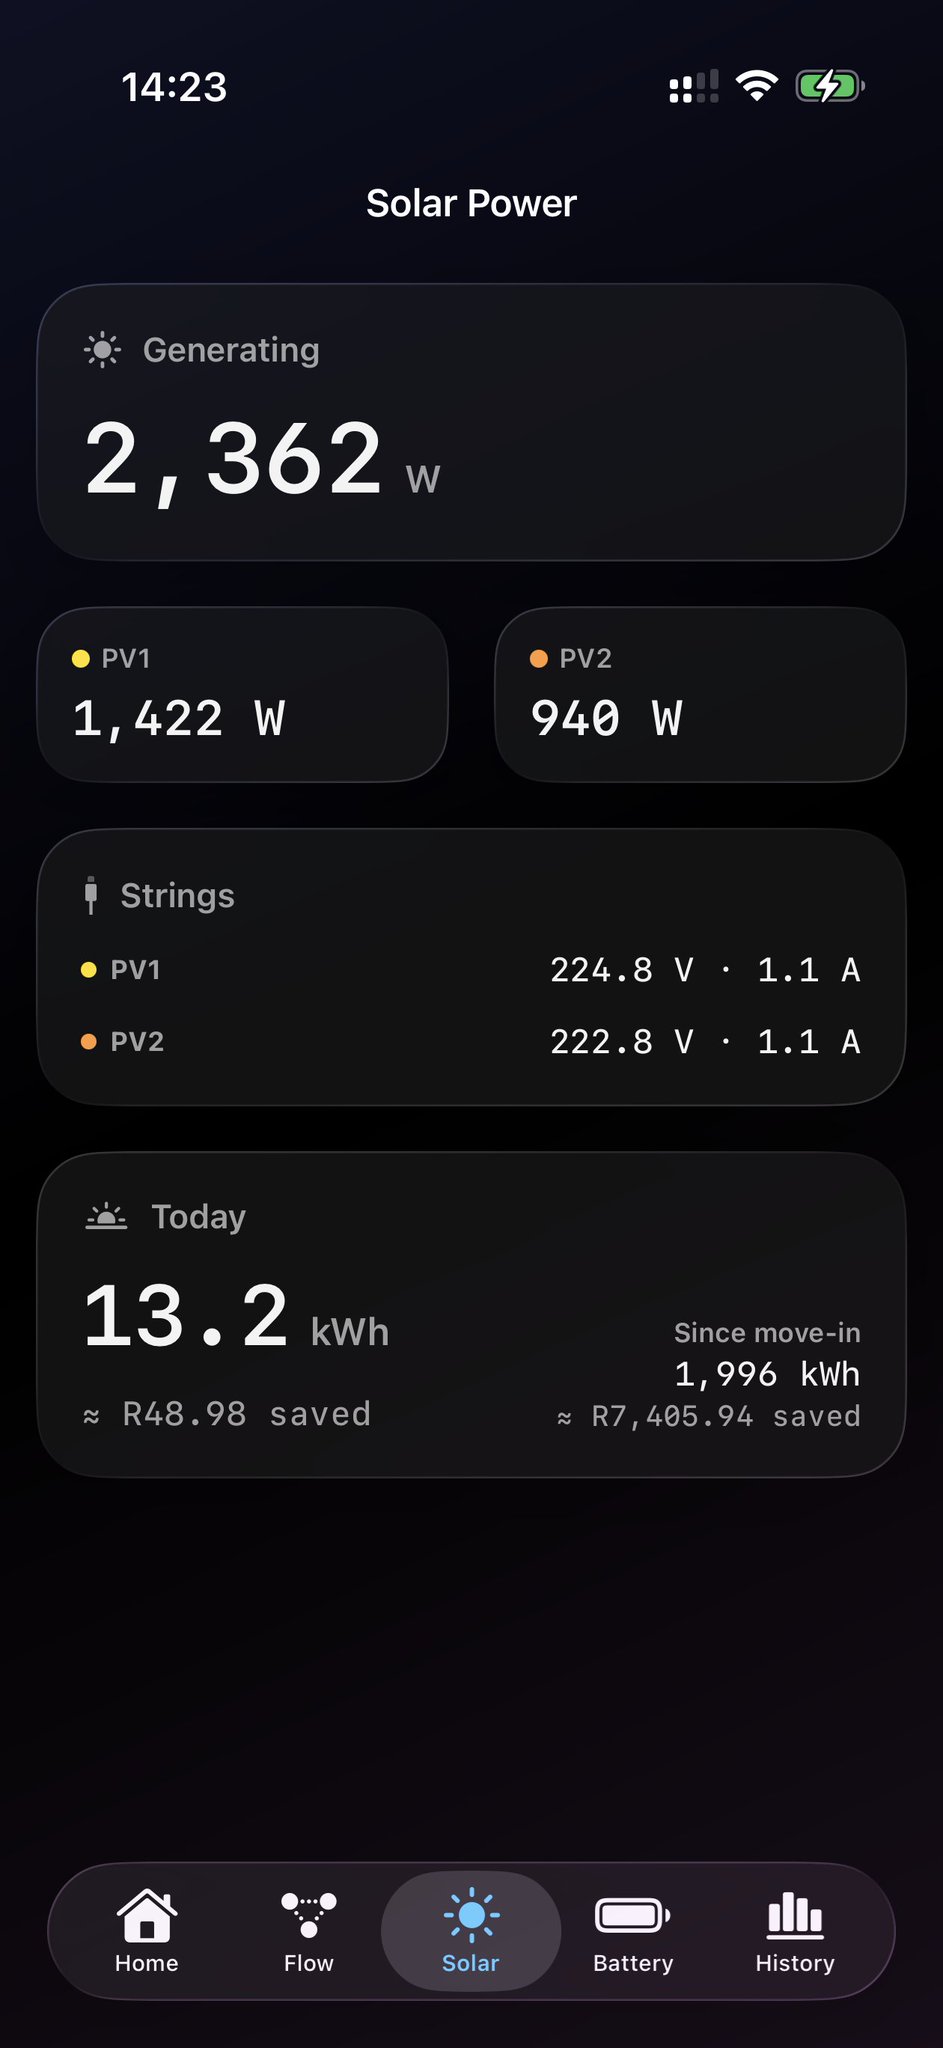
Everything is priced in Rand. We derived my true effective tariff from a real prepaid receipt (energy + VAT + vend fees), so the app shows cost/hr live, plus a daily scoreboard: what the grid cost vs what the sun saved. Lifetime solar savings: R7,400+ and counting.
12:34 PM UTC · Aug 19, 2026 · 1.1K Views
1080

Wiza Jalakasi
@wizaj
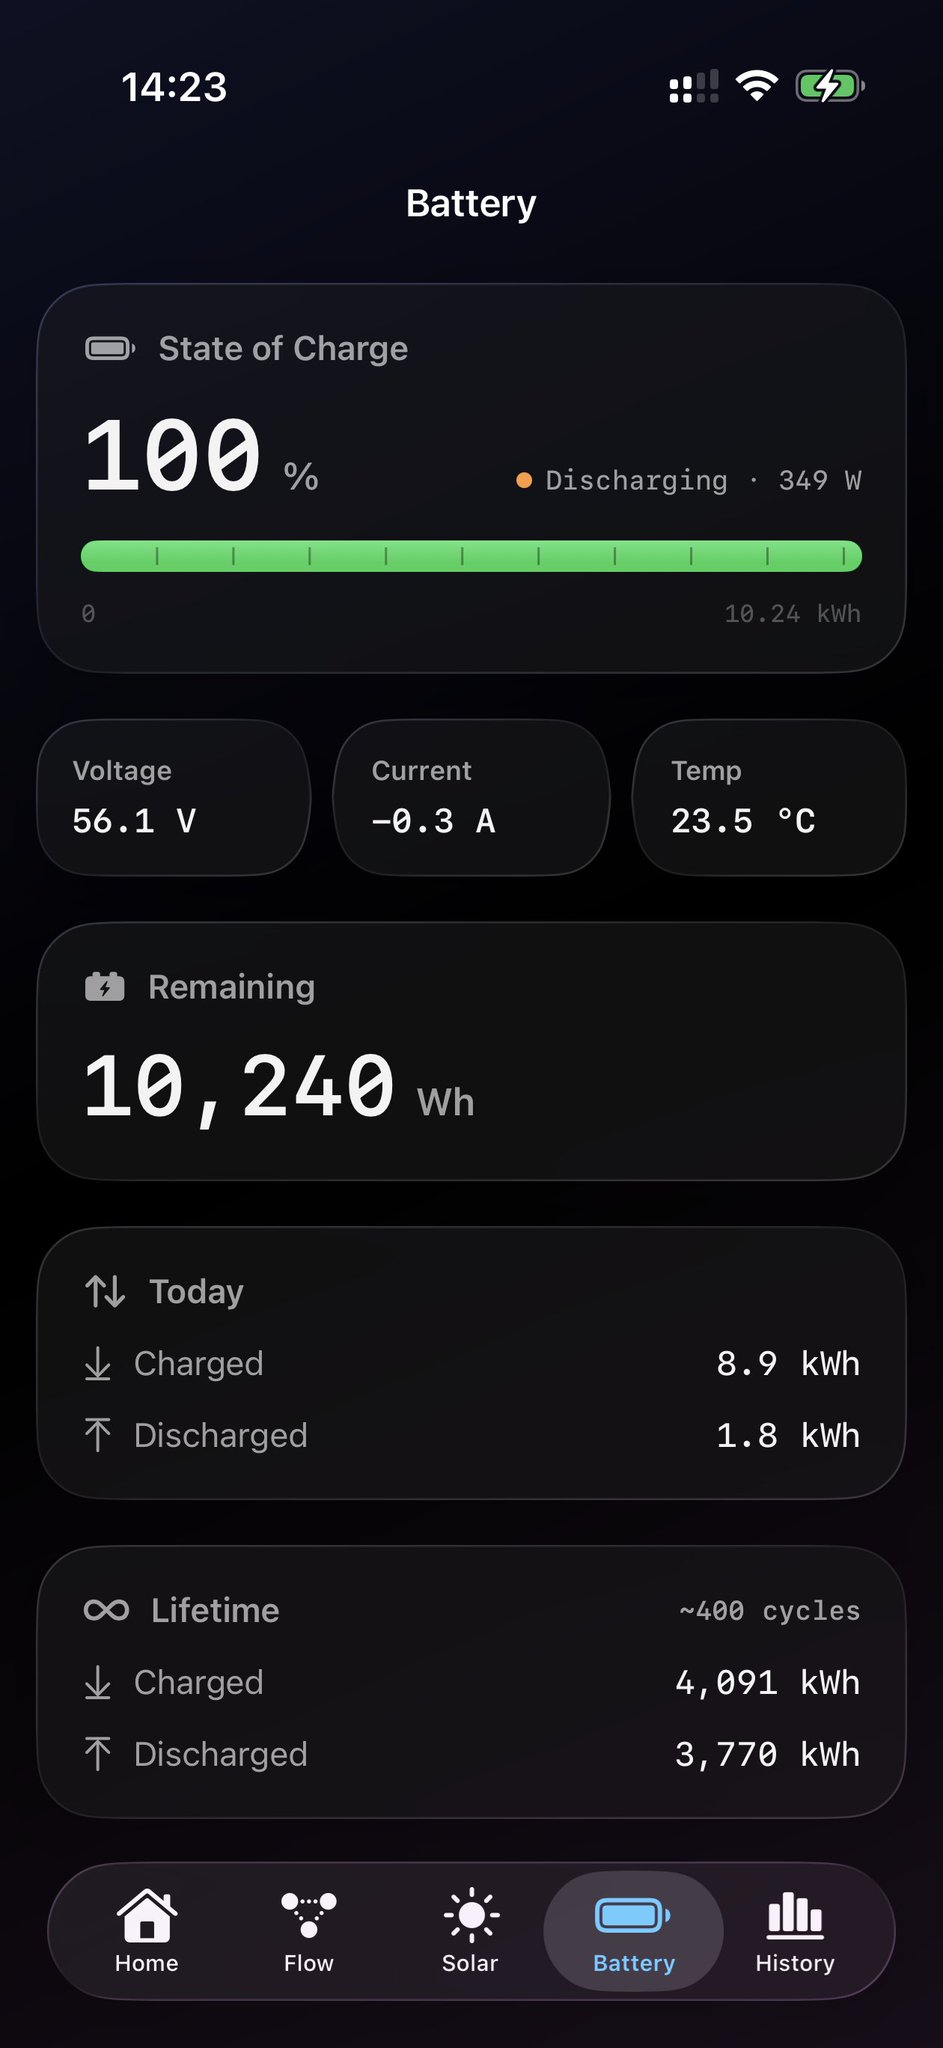
Best hack: the inverter's lifetime battery counters aren't documented. Claude probed candidate Modbus registers, decoded them (u32, low-word-first, ÷10) and cross-checked against known totals. Now the app shows lifetime charge/discharge and a battery cycle counter (~400 so far).
12:34 PM UTC · Aug 19, 2026 · 931 Views
1070

Wiza Jalakasi
@wizaj
Debugging story: a phantom client kept our live stream running at full tilt. We added per-client IPs to the health endpoint… and caught a forgotten iOS simulator on another Mac that had been reconnecting for days. Cheap observability pays for itself instantly.
12:34 PM UTC · Aug 19, 2026 · 798 Views
1050

Wiza Jalakasi
@wizaj
The wild part: Claude built nearly all of it headlessly — running xcodebuild, screenshotting the simulator to review its own UI, deploying builds to my iPhone over WiFi, committing to git, and shipping backend changes to the Pi. 30 builds across two evening sessions.
12:34 PM UTC · Aug 19, 2026 · 813 Views
1050

Wiza Jalakasi
@wizaj
Started as 'just poll my meter'. Ended with live gauges, an energy-flow map, solar & battery pages, history charts, and a daily me-vs-utility scoreboard.
Current standing: the sun is winning. ⚡☀️
Current standing: the sun is winning. ⚡☀️
12:34 PM UTC · Aug 19, 2026 · 840 Views
1170